AgriTech / Web App / End-to-End Product Design


Shrimpl is an platform with the mission to make shrimp farming smarter and more sustainable. It helps farmers turn complex data into clear, actionable insights to improve productivity and reduce risk.
Project overview
Overview
Shrimpl is a digital aquaculture platform that helps shrimp farmers manage daily operations, monitor farm performance, and make better farming decisions through data.
As the platform expanded, one limitation became increasingly apparent. While users could record operational data and monitor farm performance, there was no structured way to plan an entire farming cycle before production began. Farmers still relied on personal experience, handwritten notes, or external documents to organize activities, resources, and monitoring schedules.
The Farming Plan was created to close this gap by giving farmers a centralized workspace to plan, execute, and monitor their operations throughout the entire farming cycle.
The project covered the complete product design process, from research and information architecture to interaction design and high-fidelity interfaces. Rather than designing another management tool, the goal was to establish a planning framework that connected preparation, daily operations, and farm monitoring into a single workflow.
What I actually did in the project
I collaborated closely with the product manager and engineering team to redefine how farming plans were created and managed.
My responsibilities included defining product requirements, mapping operational workflows, designing information architecture, creating the interaction model, building reusable UI patterns, and validating the experience through continuous discussions with stakeholders.
Although this project built upon research conducted during my design challenge before joining the company, that initial work mainly served as a reference. After joining, the assumptions were revisited and refined based on business discussions, technical constraints, and deeper understanding of shrimp farming operations.
The Challenges
The Dashboard Was Never the Problem
The project initially began as a dashboard redesign. However, after reviewing the existing product and earlier research, it became clear that the dashboard was only the final layer of a much larger operational process.
The quality of every chart, report, and insight depended on one thing: the quality of the data collected throughout the farming cycle.
Improving visualization alone would not solve the problem. Farmers first needed a better way to plan their operations, organize daily activities, and collect meaningful data before those insights could become valuable.
Existing Product
At the time, Shrimpl already provided a comprehensive set of operational tools, including farm monitoring, operational records, inventory, finance, and environmental data. However, these features existed as individual modules with little connection between planning and execution.
Farmers could record what had already happened, but they had no structured way to define what should happen next.
This disconnect meant that operational data was often inconsistent, incomplete, or heavily dependent on each farmer's personal workflow.

Current Product Dashboard Overview
Project Challenges
Disconnected Workflow
Planning, operations, and monitoring existed as separate experiences.
Inconsistent Data
Farm data depended heavily on individual working habits and manual input.
Complex Farming Operations
Every farm follows different routines, resources, and production strategies.
Scalable Planning
The platform needed a flexible planning system that worked across different farm sizes and farming methods.
The challenge was no longer improving the dashboard. It was creating a planning experience that connected preparation, daily operations, and farm monitoring into one continuous workflow. The solution needed to help farmers plan with confidence while generating more consistent operational data throughout the farming cycle.
Research Summary
Instead of evaluating the dashboard independently, we stepped back and examined the entire farming workflow.
The research combined findings from my earlier design challenge, interviews with internal stakeholders, product walkthroughs, and continuous discussions with domain experts after joining the company. While the initial challenge helped establish personas, user journeys, and early assumptions, those findings were treated as references rather than final conclusions and were refined throughout the project.
One observation quickly became clear:

The dashboard represented only the final stage of a much larger operational system.
Understanding the Challenge
Before exploring possible solutions, I revisited the company's previous UX research, including user interviews, personas, journey maps, and usability findings completed before I joined the team.
Rather than validating interface problems, I wanted to understand where the existing product stopped supporting farmers and what information was still missing before a farming cycle even began.
This led to a single question that guided the rest of the project.

How might we design a flexible, low-effort farm management experience that works for users with different roles, habits, and digital skills, while encouraging regular and meaningful data collection through clear guidance, automation, and relevant insights?
Rather than focusing on dashboards, this question shifted the project toward understanding how operational data is generated on real shrimp farms.
Understanding Farm Data
The next step was understanding how farm data was actually generated.
Working with the CTO and existing product documentation, I analyzed every data source used throughout the platform. Rather than looking at individual metrics, I focused on two fundamental questions.
Data Source - Where farm data comes from
Operational data could originate from several sources. Some information was manually recorded by farmers during feeding, water quality monitoring, shrimp sampling, or harvesting. Other data was automatically generated through satellite imagery, market information, and system calculations.
For example, pond boundaries could be detected using satellite imagery, while stocking numbers were entered manually. Combining both sources allowed the platform to calculate stocking density, survival rates, and other production metrics automatically.
Understanding these relationships established the foundation for how data should be collected throughout the product.

Data Break Down

Data Relationship Diagram
Data Frequency – How often data is generated
Knowing where data originated was only part of the picture. I also needed to understand when different types of information became available.
Some operational activities happened every day, while others occurred weekly, monthly, or only during specific farming stages. External information such as satellite imagery or market prices followed completely different update cycles and could not always be relied upon at fixed intervals.
Rather than treating every data point equally, the product needed to respect these different rhythms of farm operations.
This insight later influenced how activities, monitoring schedules, and data planning were structured.
Learning Real Farming Practices
Understanding farm data explained what information needed to be collected. The next challenge was understanding how farmers actually organized their work.
Working closely with aquaculture specialists, I studied real farming practices used throughout an entire shrimp farming cycle. One observation appeared consistently across different farms: farmers rarely think about farming as one continuous timeline. Instead, they naturally divide production into phases, with each phase introducing different priorities, activities, and monitoring requirements.
For example, the early larval stage requires frequent feeding, water treatment, and close health monitoring to reduce mortality. As shrimp mature, operations become more predictable, shifting toward routine feeding and periodic health checks.
This phase-based workflow later became the foundation for structuring both Activities and Data Planning within the Farming Plan.

Shrimp farming workflow showing farming phases and activities within each phase.
Breaking the farming process into phases became a critical reference for the rest of the project. It established the structure for planning activities, scheduling operational tasks, organizing monitoring requirements, and eventually designing the Farming Plan itself.
Equally important, this phased workflow aligned with how the existing Operations dashboard recorded farm activities, ensuring that future planning workflows could transition naturally into day-to-day farm operations without disrupting existing processes.
Breaking Down the Existing Platform
With a clearer understanding of farming operations, I returned to the existing product to identify how these activities were currently supported.
I analyzed every module, reviewed operational responsibilities, and mapped how information flowed throughout the platform. This process revealed seven core operational areas that together represented the complete farming lifecycle.
Summary focused on overall farm performance, team progress, and data completion.

Summary Breakdown
Operations managed daily farming activities such as feeding, water quality, shrimp growth, stocking, and harvesting.

Operation Breakdown
Finance connected operational planning with production costs and revenue forecasting.

Finance Breakdown
Risk Monitoring helped identify early warning signs before diseases spread across ponds.

Risk Breakdown
Inventory tracked farming resources while supporting operational planning.

Inventory Breakdown
Rather than existing as independent modules, these areas represented different stages of the same farming operation. This analysis became the starting point for defining the product architecture.
Research Outcome
By the end of the research phase, the project had evolved far beyond a dashboard redesign.
The research revealed that successful farm management depends on connecting planning, operations, monitoring, and data collection into one continuous workflow. More importantly, it introduced the concept of the Digital Twin, where every farming plan becomes a digital representation of real farm operations, continuously updated through operational data throughout the farming cycle.
This vision established the foundation for the next phase of the project: translating research into a product structure capable of supporting planning before farming even begins.

Aquaculture Digital Twin Concept (Source: AI Generated)
Design foundation
From Research to Product Strategy
The research revealed that the missing piece wasn't another operational tool. Farmers already had ways to record data, monitor ponds, and manage daily work. What they lacked was a structured way to plan an entire farming cycle before operations began.
This shifted the project's direction from redesigning individual screens to defining a new product layer that connected planning with execution. Instead of treating planning as a collection of independent forms, the Farming Plan became a shared workspace where production strategies could be created, refined, and later transformed into day-to-day operations.
The challenge was no longer deciding what needed to be planned. It became deciding how that planning experience should work.

Farming Plan - Simplify Sitemap
Building on an Existing Design System
The Farming Plan was designed as part of the existing Shrimpl platform rather than as a standalone product.
To maintain consistency across the ecosystem, the project adopted the Material UI design system and existing component library. This allowed the team to focus on solving workflow and information architecture problems instead of rebuilding interface components from scratch.
Working within an established design system also made it easier to integrate the Farming Plan with existing modules, ensuring a consistent experience while reducing implementation effort.

MUI Design System
Rethinking the Product Layout
One of the earliest design challenges had nothing to do with the Farming Plan itself. It was the overall product layout.
As the new planning workspace evolved, it became clear that the existing interface could no longer support the growing number of product modules. The original layout relied on repeated combinations of vertical navigation, horizontal navigation, cards, and nested content, creating a visual hierarchy that became increasingly difficult to follow.
Rather than introducing another isolated layout for the Farming Plan, I explored how the overall product structure could be redesigned to support future features as well.
After multiple iterations and design reviews, the product adopted a two-level navigation system. Primary product modules are organized through vertical navigation, while each module uses horizontal navigation to guide users through related workflows.
This change not only improved the Farming Plan, but also established a reusable structure for future features across the platform.
Comparison between the original product layout and the redesigned application framework.
Designing the Farming Plan Framework
With the overall product structure established, the next step was designing the Farming Plan itself.
Starting from the sitemap and user flows developed during research, I created a series of low-fidelity wireframes to explore different ways users could plan an entire farming cycle. Several approaches were considered, including single-page forms, step-by-step wizards, and tab-based workspaces. Each option was evaluated against flexibility, scalability, and implementation effort.
The biggest discussion centered on whether planning should be completed in a fixed sequence or remain flexible. Early concepts encouraged users to complete one stage before moving to the next. However, conversations with stakeholders revealed that farming plans are rarely created by a single person. Operational planning often involves managers, technicians, and farm owners working on different parts of the plan simultaneously.

Farming Plan Setup

Farming Plan Preview

Edit Farming Plan
The final direction adopted a tab-based workspace, allowing users to move freely between planning sections without losing context. This structure also became reusable across other product workflows, including editing existing plans and managing farming operations, reducing both design and development effort.
More importantly, this decision reinforced another product direction established during the project. The platform shifted from a farm-centric model, where work revolved around individual farms, to an organization-centric model that allowed multiple people to collaborate around the same planning process.

Farming Plan Latest Layout Version
Simplifying Complex Planning Workflows
Although the overall framework had been established, two modules remained significantly more challenging than the others: Activities and Data Planning.
Unlike standard forms, both modules needed to represent hundreds of operational decisions spread across an entire farming cycle while remaining understandable for users with different levels of technical experience.
These two modules became the primary focus of exploration throughout the design process.
Activities Module
Designing the Activities module meant translating real farming operations into a digital planning experience.
Using the phase-based farming research as a foundation, I first sketched different approaches before comparing them with planning tools, scheduling systems, and timeline interfaces used in other products. These references were then translated into low-fidelity wireframes to evaluate how activities, dates, phases, and responsibilities could be presented together.
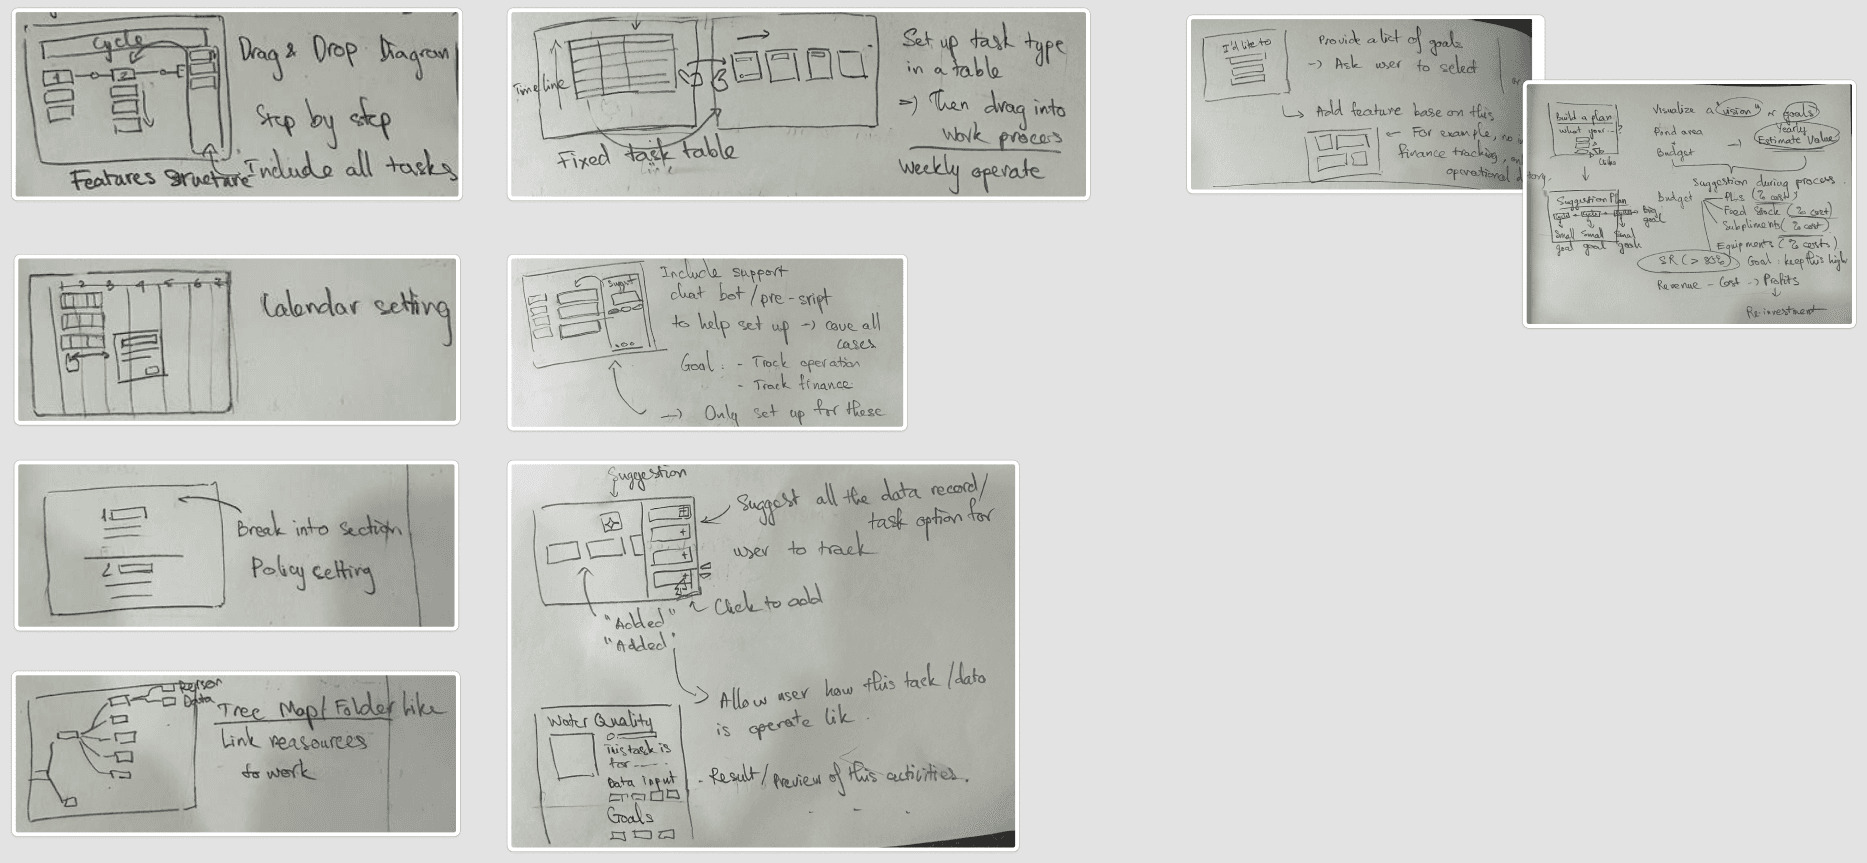
Early paper sketches exploring different activity layouts and interaction concepts.
Several layouts were explored, including traditional tables, calendars, vertical timelines, and hybrid structures. Each solved part of the problem, but introduced new challenges when representing long farming cycles or large numbers of activities.

Visual research comparing scheduling, timeline, calendar, and project management interfaces.

Low-fidelity wireframes showing the evolution of the Activities module toward the final timeline layout.
The final design adopted a timeline-based workspace that organizes activities around farming phases rather than individual dates. This better reflects how farmers already think about production while making large planning schedules easier to scan and manage.
Data Planning Module
Unlike Activities, the interaction pattern was already established through the timeline framework. The real complexity came from restructuring more than one hundred existing data points into a system that was easier for farmers to understand.
The original platform grouped information by technical data names, making navigation difficult for users unfamiliar with the system. Early concepts explored organizing data through colour-coded categories and icon systems. While visually distinctive, these approaches introduced unnecessary visual complexity and raised accessibility concerns, particularly for users with colour vision deficiencies.

Color-coded data groups

Early concepts using color-coded data groups and categorized timelines.
The final direction reorganized information around operational purpose instead of technical terminology. Farmers first decide what they want to monitor before scheduling when that information should be collected.

Organizing Data Collection by Purpose

Configuring Data Collection Timeline
Although this solution introduced an additional planning step, it created a clearer mental model while maintaining compatibility with existing dashboards and historical records. Users can also create custom data points, allowing the platform to support both legacy workflows and future operational needs without disrupting existing farms.
Balancing Product Logic and Technical Constraints
The final challenge extended beyond interface design.
Every planning decision influenced other parts of the platform. Activities affected labour planning, inventory usage influenced financial forecasts, stocking strategies impacted production planning, and different species introduced variations in operational schedules and data collection.
Throughout development, many design decisions required close collaboration with engineers and product managers to balance usability with implementation complexity.
Some ideas, such as supporting polyculture farming within a single planning workflow, were explored but postponed due to technical constraints. Rather than expanding the scope, the team prioritised building a stable foundation capable of supporting future iterations without compromising the overall product experience.

Design review snapshots
By the end of the design phase, the Farming Plan had evolved from a planning interface into a product framework that connected planning, operations, monitoring, and future product development around a single workflow.
Final Design
Bringing the Farming Plan to Life
The final product transforms the research findings into a connected planning experience that guides farmers from preparation to daily operations.
Rather than treating planning, monitoring, and execution as separate tools, the Farming Plan establishes a single workspace where production strategies can be created, adapted, and carried throughout the entire farming cycle.
Every planning module was designed around real farming practices, allowing the product to support both experienced farmers and organizations managing multiple farms at scale.
Browsing & Discovering Farming Plans
Planning does not always begin from scratch. To help farmers get started more quickly, the Farming Plan includes a shared library where users can browse, search, and reuse existing farming plans. Instead of overwhelming users with detailed configurations, each plan provides enough context for users to understand its purpose before exploring the complete setup.
The planning library also integrates with Deep Aqua, allowing the platform to recommend suitable farming plans based on mapped pond locations, farming regions, and pond sizes. This gives users a practical starting point while still allowing every plan to be customized to local conditions.

Farming Plan Library

Deep Aqua integrate with Farming Plan Library
Reviewing a Farming Plan
Before applying a plan, users can review every part of its configuration. Activities, resources, monitoring schedules, financial planning, and operational settings are presented within a single workspace, allowing users to understand how experienced farmers organize an entire production cycle before adapting the plan to their own farm.
Rather than acting as a fixed template, every farming plan becomes a starting point that can evolve according to each organization's operational needs.
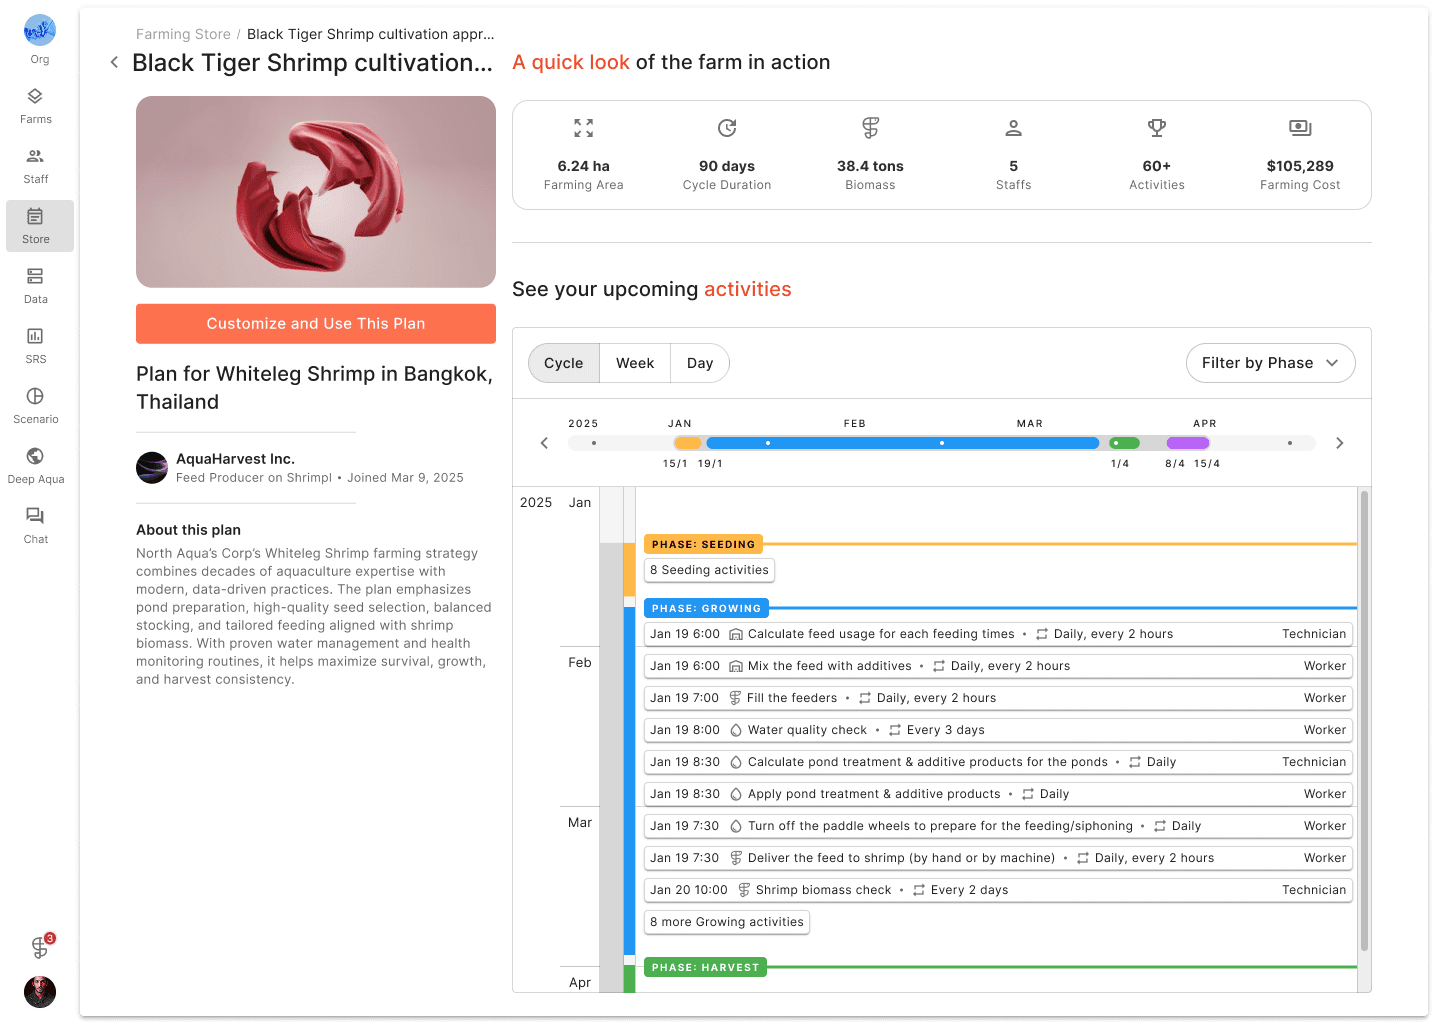
Plan Details
Planning Farm Activities
Activities form the operational backbone of every farming plan.
Instead of planning individual tasks in isolation, activities are organized around farming phases, reflecting how shrimp farmers naturally manage production in practice. As the farming cycle progresses, scheduled activities evolve with changing operational priorities, creating a planning experience that mirrors real farm operations rather than a traditional calendar.
This phase-based structure also creates a clearer relationship between planning and execution, allowing operational activities to transition directly into the Farming Operation module.

Activities Planning - Adding new activities

Plan Details - Phases added
Planning Operational Data
Operational data follows the same planning structure as farm activities.
Rather than asking users to configure hundreds of individual data points, the system organizes monitoring around operational purposes before scheduling when information should be collected. This approach simplifies one of the most complex parts of farm management while remaining compatible with the platform's existing dashboards and historical records.
The module also supports custom data points, allowing organizations to extend the planning framework without disrupting existing workflows.

Data Planning - Grouping Data Point

Data Planning - Scheduling Data Point
Planning Resources
Farm planning extends beyond activities and monitoring.
The Farming Plan also allows organizations to prepare inventory, staffing, equipment, and operational resources before production begins. Because these resources remain connected throughout the planning process, changes made in one area can be reflected across related modules such as finance, operations, and inventory management.
Planning resources together reduces duplicated work while providing a clearer understanding of operational requirements before farming starts.

Stock & Harvest Planning

Staff Planning

Inventory Planning
Financial Planning
Financial planning is directly connected to operational planning rather than treated as a separate business process.
Inventory usage, staffing, production strategies, and stocking plans all contribute to projected costs throughout the farming cycle. This relationship allows users to estimate operational expenses while planning instead of calculating them after production has already begun.
By connecting finance to everyday farming decisions, the product encourages more proactive production planning.

Finance Planning
Monitoring & Operational Readiness
The Farming Plan is designed to continue supporting users after planning is complete.
Once activated, planned activities and monitoring schedules become operational guidance that supports day-to-day farm management. Planned data collection contributes to dashboards, monitoring, and reporting, while the Farming Plan continues to evolve alongside real farm operations.
This creates a continuous relationship between planning and execution rather than treating them as separate stages.
Project Outcome
The Farming Plan introduced a new way of thinking about farm management, and early adoption showed positive signs even before the feature matured.
Users adapted existing features to plan worker activities, validating the need for structured operational planning.
Can Tho University partnered with the team to develop standardized farming plans for research and practical use.
The project established the foundation for expanding Shrimpl from farm monitoring into a complete farming planning platform.
Retrospective
This project began as a dashboard redesign but ultimately became a much broader product initiative.
By stepping back from the interface and studying how shrimp farming actually works, the project uncovered an opportunity to rethink the relationship between planning, operations, and monitoring. The result was not simply a new feature, but a product framework that establishes how future farming workflows can be structured across the platform.
There are still opportunities to refine parts of the experience, particularly within Activities and Data Planning, where balancing flexibility with simplicity remains an ongoing challenge. Even so, the project established a scalable foundation capable of supporting future product development without losing sight of how farmers work in practice.
Key Learnings
Build Products Around Real Workflows
Understanding how farmers actually manage production led to a solution that felt familiar instead of forcing users to adopt new behaviours.
Product Architecture Shapes the Experience
Designing the overall framework was just as important as designing individual interfaces.
Good Planning Creates Better Data
Consistent operational planning naturally leads to better data quality, stronger monitoring, and more meaningful insights.